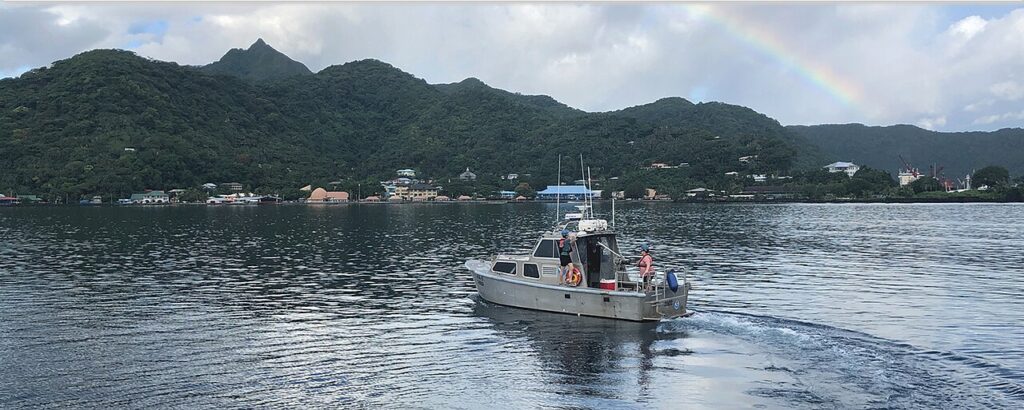
A seabed map a ship can navigate on is a set of depths, each with a known position, collected on survey lines with the coverage overlap a hydrographic specification requires between those lines and checks. A fish-finder screenshot is a picture from one pass under one boat. It stops being a chart the moment it has no survey position behind it, and it is false wherever the boat’s position was wrong when the depth was stored.
Right for this job — Hydrographic survey data: depths collected on planned survey lines (mainscheme and crosslines), with overlapping coverage evaluated and each sounding tied to a known position, then used to update nautical charts.
Wrong for this job — A recreational fish-finder screenshot or any single-pass sonar view treated as if it were a hydrographic chart or a surface a ship may navigate on.
The number that decides it — Not applicable as a single invented meter figure. The gate is whether each depth has a known survey position on a line plan with the overlap the hydrographic page describes—not whether a screen looked deep.
What the spec leaves out — Hobby fish-finder screenshots are outside hydrographic survey deliverables. A maker’s sonar view is a display of returns under the boat, not a certified navigational chart product.
Check before you rely on it — Official chart first. Confirm survey lineage, datum, and positioned depths. Do not place a depth on a map if you cannot say where the boat was when it was measured.
Last checked (September 29, 2026) — Sources opened and verified on this date (NOAA hydrography pages, NOAA Hydrographic Surveys Specifications and Deliverables, Garmin fishfinder view page).
What the echo sounder and the position are doing
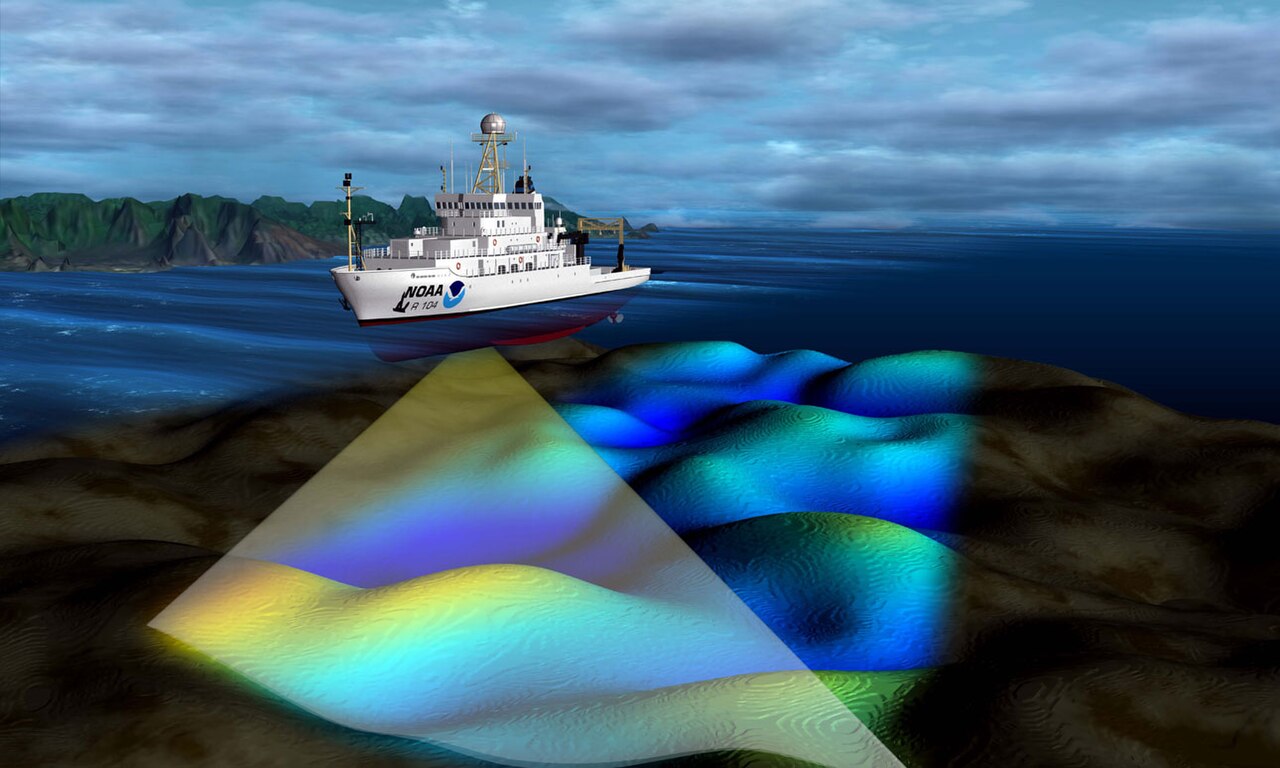
On a hydrographic survey vessel, the depth sensor and the positioning system work as a pair. NOAA’s Office of Coast Survey describes surveying with multibeam echo sounders as the primary method of obtaining hydrographic data: the beams sweep the seafloor as the ship passes over the survey area, bounce off the bottom, and return so the depth can be recorded. That is the survey transducer’s job—measuring water depth under controlled acquisition, not producing a casual screen grab.
Depth alone is not enough. NOAA’s hydrographic surveying page is blunt about the other ingredients: accurate positioning and water levels (tides) are essential to charting. Raw soundings are put in context by referencing them to the location at which they were collected; horizontal positions are recorded with differential Global Positioning System equipment. In other words, each useful depth is a depth tied to a known place. A depth without a position is a number floating in the water column of the story. A position without a controlled survey—without lines, coverage rules, and corrections—is not a charted seabed.
NOAA’s Hydrographic Surveys Specifications and Deliverables (HSSD) treat that pairing as non-negotiable for data meant for Coast Survey products. Point cloud data submitted to the Office of Coast Survey must be corrected for accurate three-dimensional positioning of the points. Field units must state the positioning method when they describe quality control. Equipment lists separate the positioning system from the depth or height sensor. That language exists because a sounding filed at the wrong coordinates poisons the map at that place.
A fish finder does something narrower. A recreational maker’s fishfinder page describes sonar views that help you view fish in the area: full-screen, split-screen, split-zoom, and split-frequency arrangements of returns under the boat. That is a view. It does not, by that fact, produce a navigational surface. The transducer on a small boat and the multibeam echo sounder on a survey ship both use sound, but only the survey pairs controlled depth acquisition with survey positioning, line plans, and coverage rules that feed chart products.
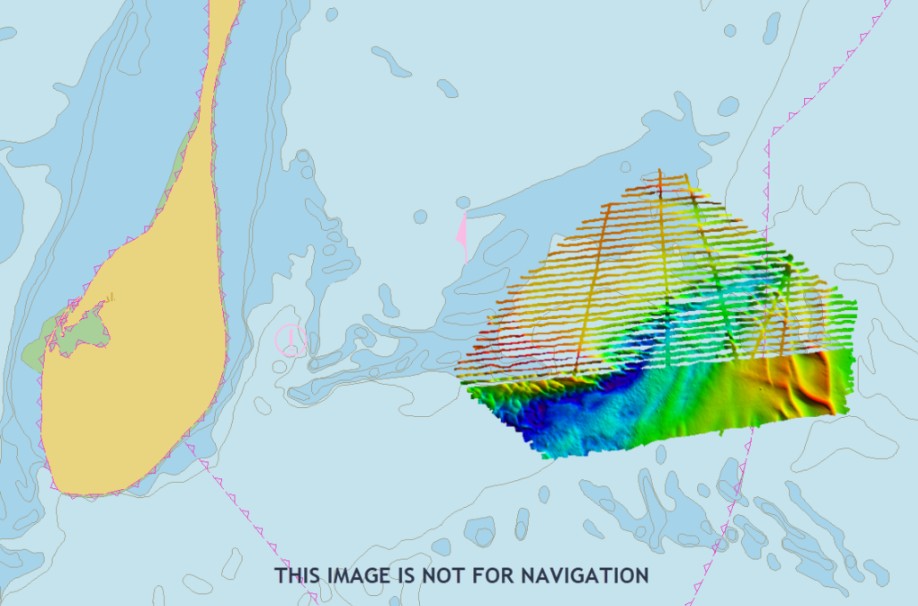
Survey lines are how that pairing becomes a surface instead of a streak. The HSSD talks about mainscheme lines—the primary pattern run across the area—and crosslines that cut across them so overlapping coverage can be checked. The hydrographer must evaluate where crossline and mainscheme data overlap so the depths from the two sets do not disagree beyond the maximum allowable total vertical uncertainty for that depth. Junctions between neighboring surveys must carry overlap of approximately one bathymetric swath width at the nominal depth of the junction. That is coverage discipline: lines with planned overlap or full-coverage requirements, not a single recreational pass saved as a JPEG. A fish-finder screenshot has the geometry of one boat’s path. A navigational seabed map has the geometry of a survey that was designed to leave known, checkable coverage.

How a hobby snapshot fails differently from a sensor dashboard
Failure modes matter because they look similar on a bright screen and are not the same error.
One reading is not a surface. That is the point of What an ocean sensor measures, and what a data platform adds: a single sensor value—however honest—does not by itself become a continuous map of the seafloor. Stretch that idea one step further for pictures. One screenshot is not a surface either. A fish-finder frame is a timed view along one track under one hull. It has no obligation to fill gaps between survey lines, no junction overlap with another sheet, and no hydrographic lineage that would allow a mariner to treat it as charted bathymetry.
A depth number or a side picture on a small boat is not a hydrographic survey. That is the distinction carried in How a boat’s sonar differs from an ROV camera and from imaging sonar: “how deep is it here” answers a local question under this boat; “this is the chart” claims a navigational product built from positioned soundings. Confusing those two sentences is how a hobby snapshot gets promoted into something it never was.
Position error is a third failure, and it is decisive for any homemade “map.” If the GNSS position was wrong when the depth was stored, every depth tied to that fix is filed in the wrong place. The water may have been that deep somewhere—but not where the map now says. That is the same class of error discussed in How to read a chartplotter when the chart and the GPS disagree: when the boat’s believed position and the charted world part company, what you think you know about depth at a coordinate is no longer trustworthy. On a survey, wrong position makes the map false at the stored coordinates. On a fish-finder track log pasted into a basemap, the same logic applies—only without the survey’s crossline checks or Coast Survey quality path.
Say what is false when the boat’s position was wrong: the placed depth. The echo may have been real. The screen may have been honest about a return under the hull. What becomes false is the claim that this depth belongs at that latitude and longitude on a map other people might navigate on. Charted soundings inherit position as part of the product. A hobby snapshot that never proved position never earned that inheritance.

What the reader can check
You do not need a survey ticket to refuse a false chart. You need a short checklist and the pages that define the real product.
Open NOAA’s “What is hydrography?” page (https://oceanservice.noaa.gov/facts/hydrography.html), opened here on September 29, 2026. Confirm that hydrographic surveys measure depth and bottom configuration, that multibeam echo sounders are described as the primary survey method, and that the resulting data are used to update nautical charts. That page is about survey science feeding chart products—not about phone screenshots.
Open NOAA’s Hydrographic Surveying page (https://oceanservice.noaa.gov/navigation/hydro/), opened here on September 29, 2026. Confirm three linked claims in your own words: hydrographic surveys are the fundamental component of nautical charts; the numbers on a nautical chart are depth measurements acquired from hydrographic surveys; and accurate positioning plus water levels are essential, with soundings referenced to the location where they were collected. If a picture cannot speak to those points, it is not that product.
Open the Office of Coast Survey Hydrographic Surveys Specifications and Deliverables PDF on nauticalcharts.noaa.gov (https://nauticalcharts.noaa.gov/publications/documents/HSSD_2026-0-01.pdf), opened here on September 29, 2026. On a survey description, look for lines, overlap or coverage language, and positioned depths. The HSSD requires mainscheme lines and crosslines; the hydrographer must evaluate overlapping crossline and mainscheme coverage so depths do not disagree beyond the allowable vertical uncertainty for that depth; and for junction surveys the field unit must acquire overlap of approximately one bathymetric swath width at the nominal depth of the junction area. Point cloud data must be corrected for accurate three-dimensional positioning. Those are the words the page supports. Where overlap is described as a swath width rather than a percent, do not invent a percent.
Open Coast Survey’s hydrographic survey data page (https://nauticalcharts.noaa.gov/data/hydrographic-survey-data.html), opened here on September 29, 2026, if you need the product separation in one place: Coast Survey conducts surveys of the ocean floor and creates detailed hydrographic maps of depths and features; those data are compiled with other bathymetry sources to create nautical charts. That is the chart path.
Open a fish-finder maker page only to see what the device claims to show. The Garmin STRIKER Plus “Sonar Fishfinder” help page (https://www8.garmin.com/manuals/webhelp/strikerplus/EN-US/GUID-310C2C00-2820-4BC1-879B-667A6E3AEFC2.html), opened here on September 29, 2026, describes sonar views for viewing fish in the area. On a fish-finder image, expect no survey lineage, no stated chart datum for navigational soundings, and no line plan with mainscheme and crossline coverage. Do not treat the image as a chart.

The decision before you use the picture
Navigate on the official chart. Use the fish-finder view only as a view from this boat—useful for “what is returning under me right now,” useless as a substitute for survey bathymetry.
Ask one placement question before you promote any depth into a map: can you say where the boat was when that depth was measured, with a positioning method you would trust? If you cannot, you cannot place that depth on a map. A colorful track that never recorded a reliable fix is not a seabed surface. A screenshot saved because it looked deep near a known shoal is not permission to leave the charted safe water.
Do not pass closer to a hazard because a hobby image looked deep. Charts exist so mariners do not make that bargain with a single pass. A recreational sonar image may omit a rock between lines you never ran, may stretch a return that is not the least depth, and may store a truthful echo at dishonest coordinates if the position was wrong. None of those failure modes are fixed by zooming in on the picture.
One sourced fact that separates the products
From NOAA’s Hydrographic Surveying page, opened September 29, 2026: the numbers on a nautical chart are depth measurements acquired from hydrographic surveys, and accurate positioning is one of the essential ingredients that make those measurements chartable. That single pairing—depth plus known position inside a survey process—is what a fish-finder screenshot does not inherit just because both instruments use sound.
The harmful mistake
The harmful mistake is printing a recreational sonar image as if it were a hydrographic chart, or trusting a homemade seabed map after the boat’s position was wrong. The first error sells a view as a navigational surface. The second error files depths in the wrong place, so the map is false wherever those points were stored. Either way, a ship that navigates on that picture is navigating on something that was never the chart.
Read next: How a boat’s sonar differs from an ROV camera and from imaging sonar · How to read a chartplotter when the chart and the GPS disagree