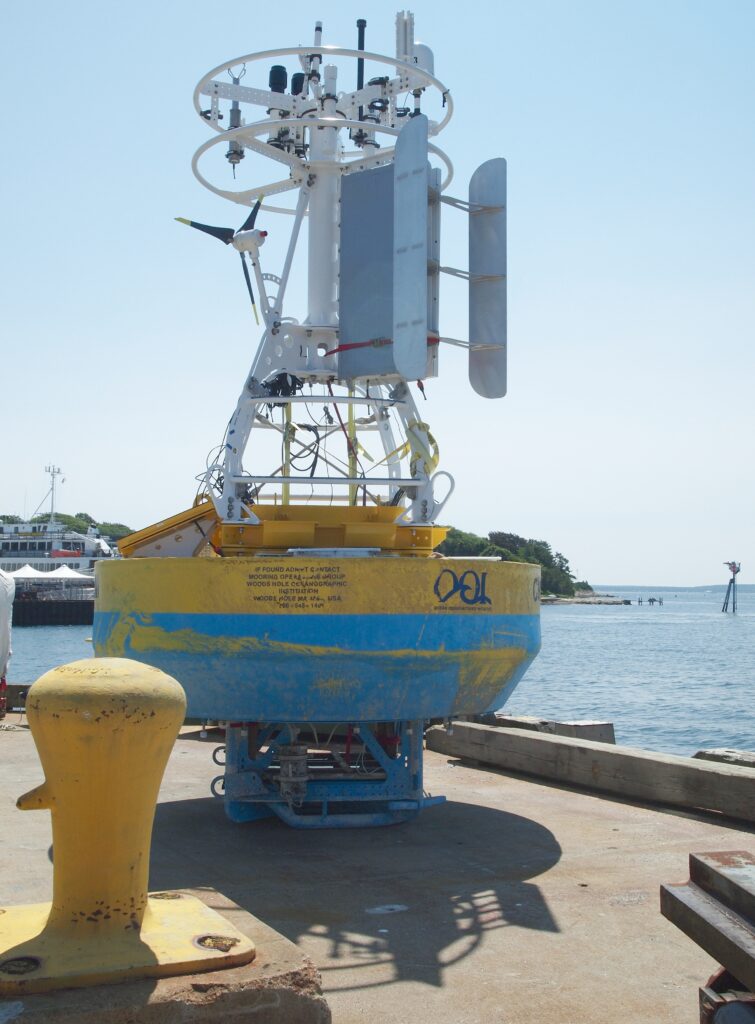
An ocean sensor on a buoy or a vehicle stores a number—temperature, salinity, pressure or depth, or current—at the place and time it measured. A data platform adds a dashboard, a track, or a forecast on top of those numbers. The platform stops being a measurement when it shows a picture the sensor did not take. One point is not the whole water column.
Right for this job: Citing a labeled station reading (for example NDBC 46042 water temperature at its stated sea-temp depth and observation time) as that point and that time only.
Wrong for this job: Treating one buoy number, a dashboard contour, or a forecast field as the temperature or current of the entire water column, or as a new observation the sensor file does not contain.
The number that decides it: Whether the value is tied to a named sensor, a place, a depth or height, and a time—or whether it is a derived display built after those readings.
What the spec leaves out: A single near-surface buoy reading does not sample the rest of the water column; a track or forecast does not invent readings between or below the stored points.
Check before you rely on it: Open the station or instrument page for the sensor name, depth or height if stated, and time; on any platform, ask whether you are looking at the raw reading or a product built on top of it.
Last checked: September 29, 2026
What the buoy or instrument is actually storing
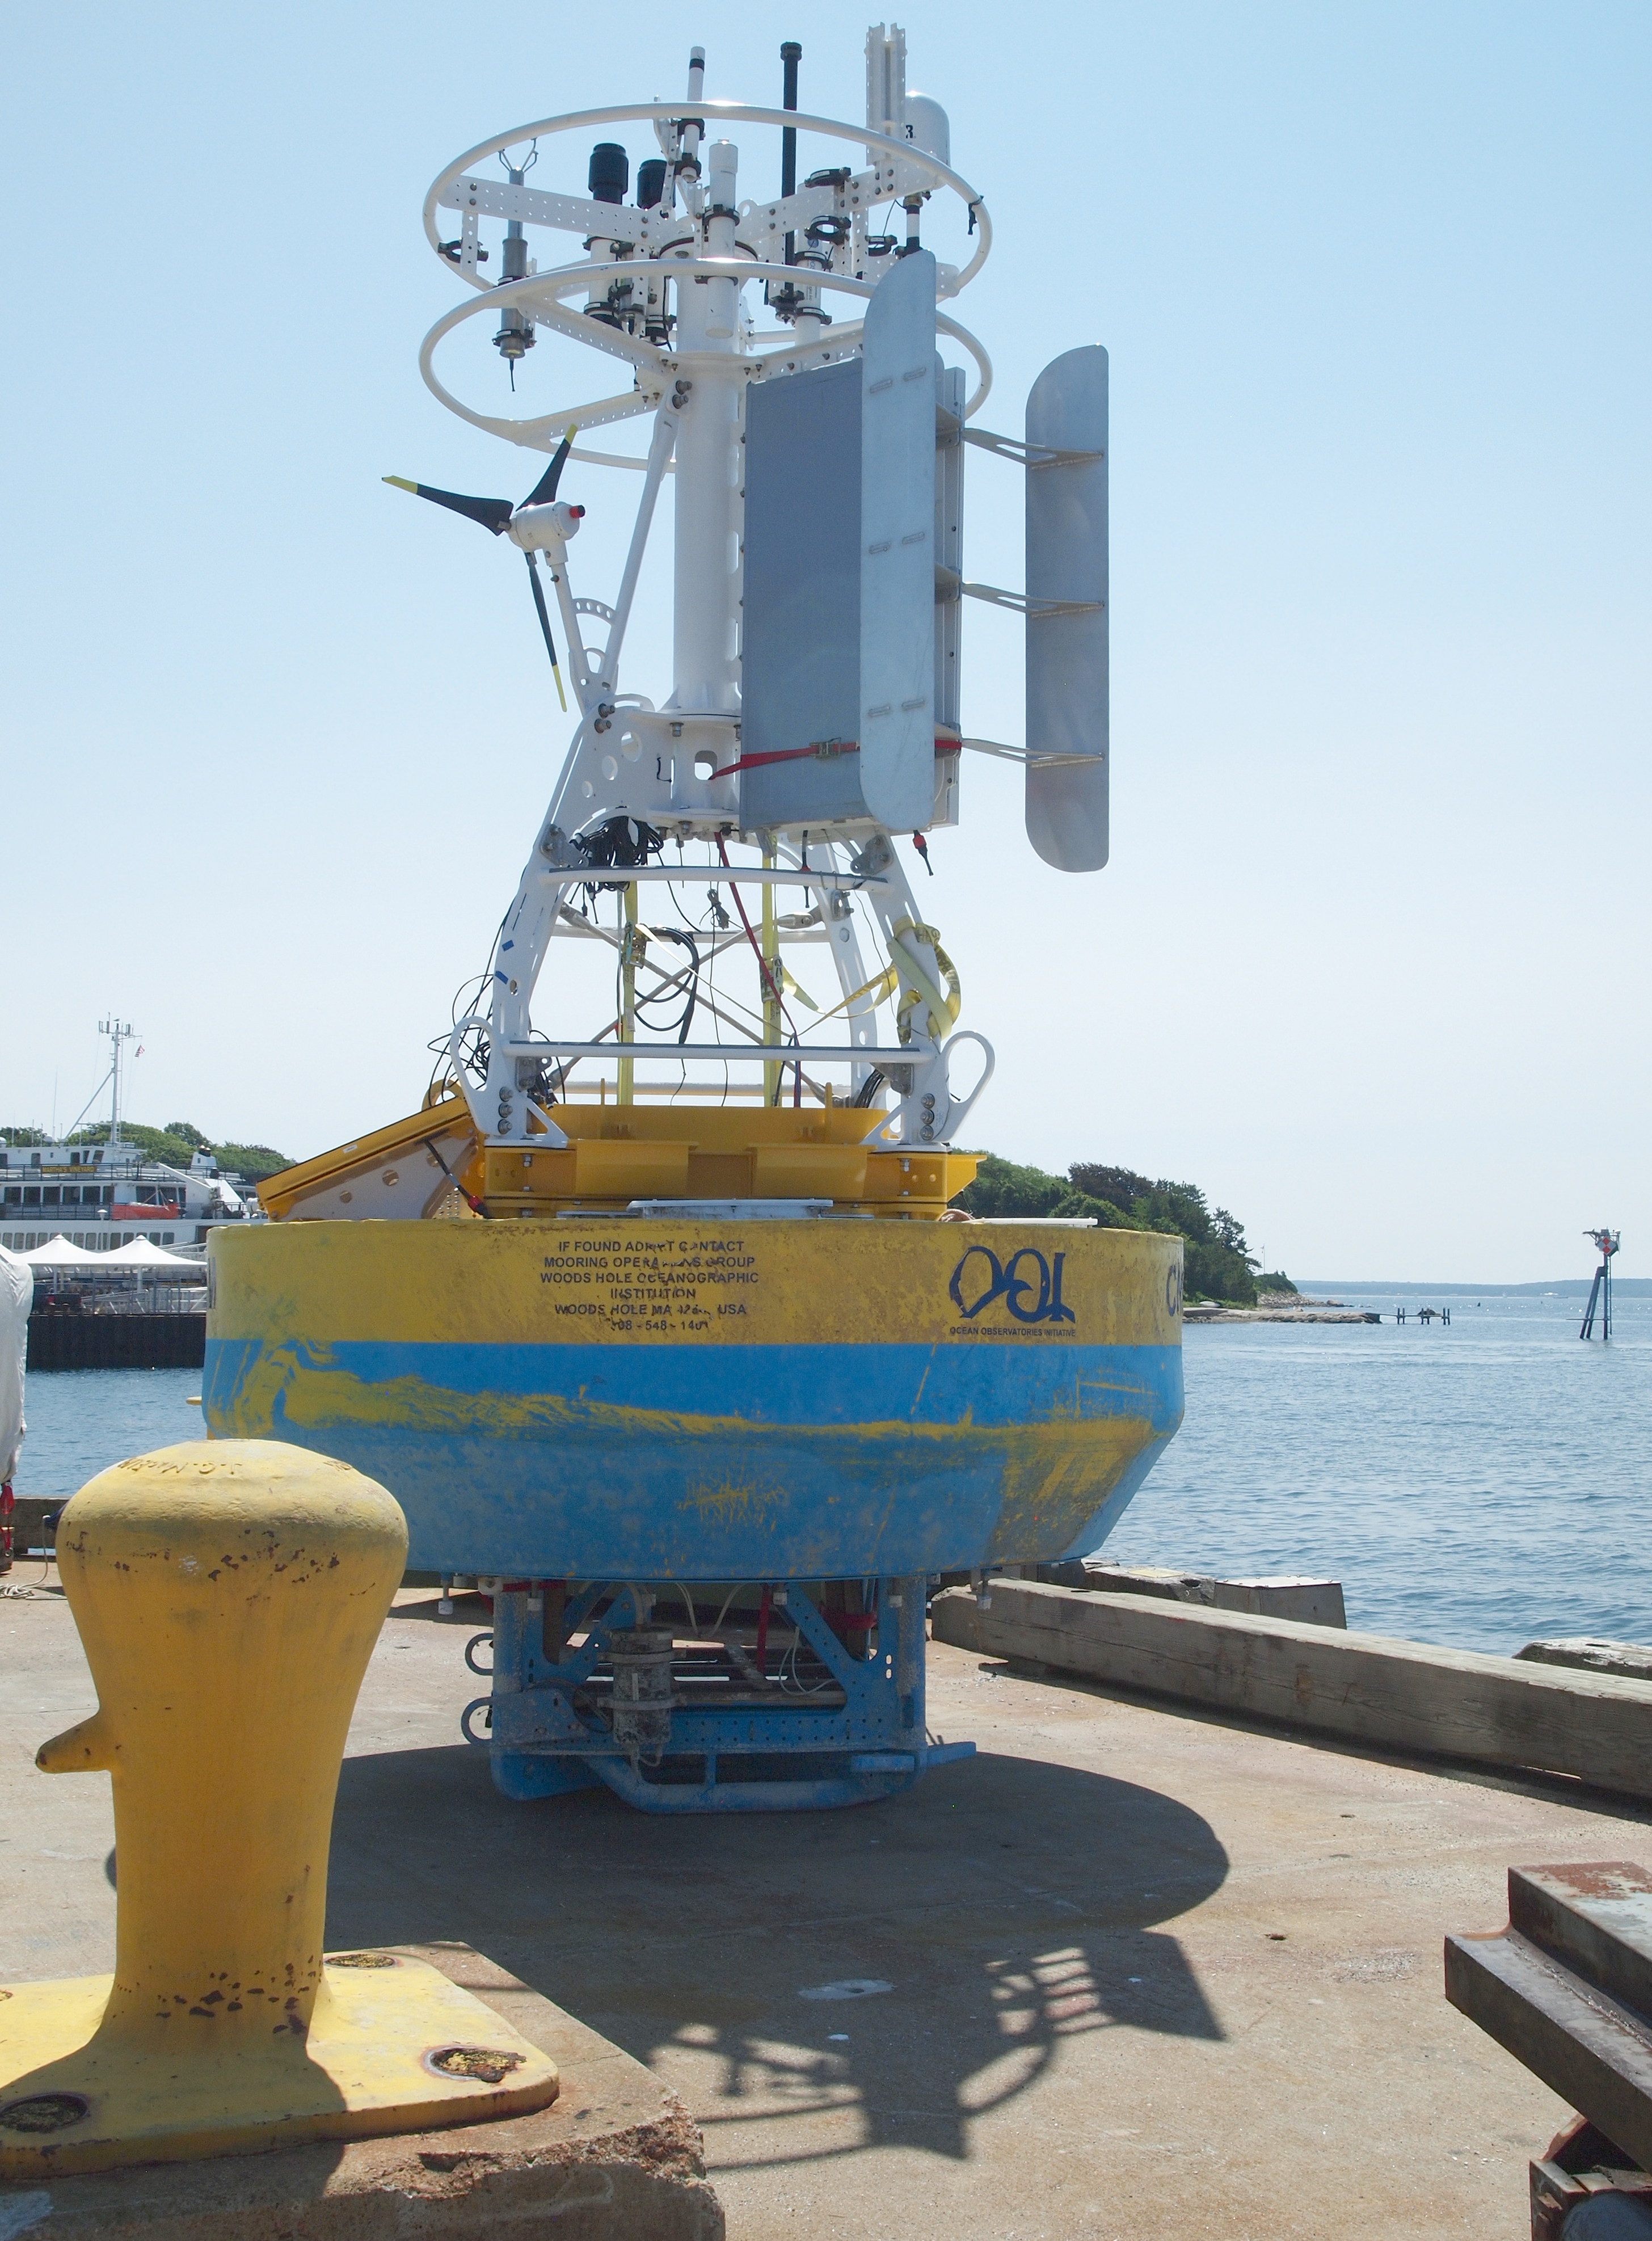
Start with a concrete station, not a slogan about “ocean data.” On September 29, 2026, the National Data Buoy Center page for station 46042 (Monterey—listed as about 27 nautical miles west-northwest of Monterey, California) described a three-meter foam buoy with a seal cage and a SCOOP payload. The page stated site elevation at sea level, air-temperature height 3.7 m above site elevation, anemometer height 4.1 m, barometer elevation 2.7 m above mean sea level, sea-temperature depth 1.5 m below the water line, and water depth 1710 m. Those heights and depths are how you know what the stored numbers refer to: each quantity belongs to a sensor location on that buoy, not to “the sea” as a single object.
At conditions labeled as of 10:00 am PDT (1700 GMT) on September 29, 2026, that same station page listed Water Temperature (WTMP) as 62.2 °F. That figure is the station’s labeled observation for that time—not a general claim about the Pacific, not a column average, and not a model result. The page also listed wind direction and speed, gust, atmospheric pressure, air temperature, and dew point for that same stamp. In the previous-observations table on the page, the salinity (SAL) column showed dashes for the rows checked around that hour, so this article does not invent a salinity for 46042. Absence on the page is absence; it is not a blank to fill.
NDBC’s measurement-description page, opened the same day, explains how those labels work in the files. WTMP is water temperature. Ocean-current records are described as a direction the current is flowing toward (0–360 degrees, with 360 due north and 0 meaning no measurable current) and a speed in centimeters per second. Expanded ADCP formats can include multiple instruments and bins, still as stored current components at those instrument settings—not as a chart of the whole basin. Salinity (SAL), where reported, is described as computed from measured conductivity, temperature, and pressure using the Practical Salinity Scale of 1978 and reported in practical salinity units. Pressure on the meteorological side of the station pages is sea-level pressure in the usual NDBC columns; that is different from the pressure a CTD uses to derive depth in a cast. Keep the labels straight: a buoy’s atmospheric pressure column is not a water-column profile.
NDBC’s sensor reporting, sampling, and accuracy page (opened September 29, 2026) lists payload tables that name Sea Surface Temperature among the parameters some onboard systems can report, with tabulated ranges, averaging periods, resolution, and accuracy for those payload types. The ARES and VEEP tables also list ADCP among parameters. Those tables are instrument specifications for what a payload can report—not a discovery that a particular contour “exists” in the ocean. Station 46042’s own page is what told us which quantities appeared for that buoy at that check, including the labeled WTMP at 1.5 m below the water line.
A current reading, when a station reports one, is still a speed and a direction at that sensor arrangement. It is not a map of the sea. A dashboard that paints arrows across a region is doing product work on top of observations and models. The observation remains the stored number with its metadata. The paint is not a new sensor.
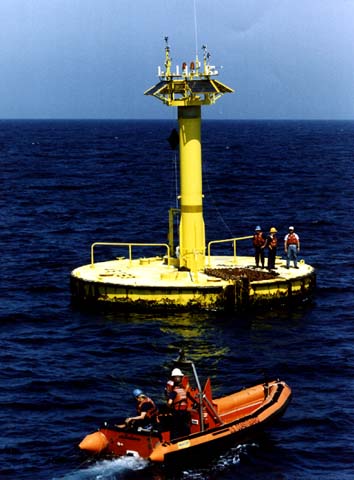
Why one stored number cannot stand in for the whole water column is easiest to see when you put the station’s own depths next to a profiling instrument. Station 46042’s page puts the sea-temperature sensor at 1.5 m below the water line while listing water depth at 1710 m. That is one near-surface temperature for one time stamp. It does not tell you the temperature at hundreds of meters, and this article will not invent a thermocline value to pretend that it does.
NOAA Ocean Exploration’s CTD pages, opened September 29, 2026, describe what a profile adds. A CTD is a package for conductivity, temperature, and depth. Its primary job is to show how conductivity and temperature change relative to depth. Conductivity relates to salinity; salinity can be derived with temperature and pressure; depth is derived from the pressure measurement with density calculated from temperature and salinity. Data from a CTD are used to generate a profile of water-column characteristics relative to depth. On ships, the package is often on a rosette with bottles that can collect water at different depths. That is many depths—not one buoy housing depth and not one surface reading stretched into a story about “the water.”
Argo’s program pages, also opened September 29, 2026, describe robotic floats that drift with currents and move up and down between the surface and a mid-water level, collecting information from inside the ocean. The observing-system page discusses Argo profiles and contrasts them with ship-based CTD casts that can go to the bottom and are used for calibration. Those pages support one limited claim used here: a profile samples more than one depth. They do not authorize inventing a feature a model “saw.”
One short caution about vehicles: an ROV’s housing depth rating is a design limit for the vehicle, not a water-column temperature or salinity profile. Do not import a depth rating as if it were a CTD cast. The rating says where the machine may go; the sensor file says what was measured where and when.
How a dashboard fails differently from a chart
A chart that claims to be a surveyed seabed product and a dashboard that draws a track of sensor readings fail in related but not identical ways. The companion piece How a seabed map is made, and why a fish-finder screenshot is not one is the right comparison for the chart side: a fish-finder picture is not a chart. Here the parallel is simpler. A track on a screen connects readings. It does not create readings between them. If the buoy reported temperature at 1.5 m at known times, the line between two stamps is graphics. The gap is still a gap.
A forecast is a model product built on observations and other inputs. It is useful when labeled as a forecast. It is not a new sensor reading. Do not say the model saw a current or a temperature the source file does not contain. Assimilation and forecast systems take observations—including buoy and profile data—and produce fields; those fields are products. When a platform shows a smooth contour across a region that has only sparse stations, the smoothness is the product’s behavior, not proof that every point on the contour was measured.
Dashboards also fail by mixing layers without saying so. A useful screen can show the raw WTMP next to a derived index or a model overlay. A harmful screen lets the overlay look like the buoy. The fix is editorial, not mystical: read the legend, the station ID, the depth, and the time. If those are missing, you are holding a picture, not a citeable observation—the same class of mistake as treating a fish-finder screenshot as a seabed map.
Platforms earn their keep when they preserve provenance: which station, which sensor, which depth, which time, and whether the pane is observation or product. They stop being measurement tools when they replace those anchors with a single dramatic image. Display is not the sensor. That idea also appears in What an autonomous ship still leaves to a person: what shows on a console is not automatically what was measured in the water.
What you can check on the pages yourself
These URLs were opened on September 29, 2026:
- https://www.ndbc.noaa.gov/station_page.php?station=46042 — Station 46042. Note the buoy type and SCOOP payload; sea temp depth 1.5 m below water line; water depth 1710 m; conditions as of 10:00 am PDT / 1700 GMT on September 29, 2026; Water Temperature listed as 62.2 °F on that page for that stamp; SAL dashes in the recent table rows checked.
- https://www.ndbc.noaa.gov/measdes.shtml — NDBC measurement descriptions for WTMP, pressure columns, ocean current direction and speed, ADCP fields, and salinity computed from conductivity, temperature, and pressure.
- https://www.ndbc.noaa.gov/rsa.shtml — Payload sensor reporting tables that name Sea Surface Temperature and, for some payloads, ADCP, with ranges and accuracy figures that are instrument specifications.
- https://oceanexplorer.noaa.gov/ocean-fact/ctd/ and https://oceanexplorer.noaa.gov/technology/ctd/ — CTD as conductivity, temperature, and depth; change through the water column relative to depth; depth derived from pressure; profiles relative to depth; bottles at different depths on a rosette.
- https://argo.ucsd.edu/ and https://argo.ucsd.edu/about/observing-system/ — Floats that move between the surface and a mid-water level; discussion of Argo profiles and ship-based CTD casts that sample many depths.
On the station page, record the sensor name (for example WTMP), the depth or height if stated (here, sea temp at 1.5 m below the water line), and the time (1700 GMT on September 29, 2026 for the conditions block used above). On any platform view, ask whether the pane is that raw reading or a derived product—track, heatmap, forecast, or index. A useful record has a place, a time, and the quantity. A screenshot of a dashboard without those is weak evidence.
The decision before you cite the number
Use the station reading for that point: station 46042’s labeled WTMP at its stated depth and time is citeable as that observation. Use a profile only when you opened a page that shows more than one depth—as the NOAA CTD and Argo pages do in describing how those instruments work. If the platform does not say the value is a measurement, do not treat it as one. Do not fill a gap with a model and then cite the gap-filler as if a buoy reported it.
That decision rule is boring on purpose. It keeps you from laundering a forecast into an observation and from stretching a 1.5 m reading across 1710 m of water because a chart looked continuous. Continuity on a screen is not continuity in the file.
One sourced fact from the station page
NDBC station 46042’s page, opened September 29, 2026, identified a three-meter foam buoy with SCOOP payload, sea-temperature depth 1.5 m below the water line, water depth 1710 m, and listed Water Temperature (WTMP) as 62.2 °F in the conditions block as of 10:00 am PDT (1700 GMT) on September 29, 2026. That is one station, one sensor depth, one time. It is not a water-column survey, and it is not a model finding.
The mistake that turns a reading into a false story
The harmful mistake is treating one buoy number—or a forecast contour drawn after observations—as the temperature or the current of the whole water column, or claiming a model observed something the sensor file does not show. Station 46042’s own metadata already blocks the first half of that mistake: 1.5 m is not 1710 m. The CTD and Argo pages block the second half by describing how multi-depth profiles are collected. The platform blocks nothing unless you read it. A dashboard track is not a new measurement, just as a fish-finder picture is not a seabed chart. Keep the sensor’s number, keep its place and time, and keep the product labeled as a product.
Read next
How a seabed map is made, and why a fish-finder screenshot is not one